|
Download Data (XLS File) |
|
|||||
|
|||||
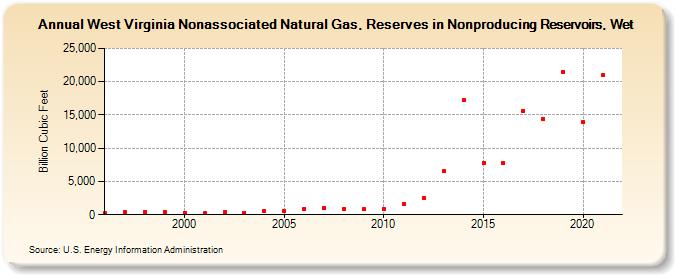
| West Virginia Nonassociated Natural Gas, Reserves in Nonproducing Reservoirs, Wet (Billion Cubic Feet) | |||||
| Decade | Year-0 | Year-1 | Year-2 | Year-3 | Year-4 | Year-5 | Year-6 | Year-7 | Year-8 | Year-9 |
|---|---|---|---|---|---|---|---|---|---|---|
| 1990's | 198 | 375 | 439 | 427 | ||||||
| 2000's | 310 | 202 | 353 | 295 | 510 | 586 | 923 | 1,010 | 920 | 815 |
| 2010's | 924 | 1,575 | 2,529 | 6,546 | 17,219 | 7,801 | 7,744 | 15,651 | 14,407 | 21,473 |
| 2020's | 13,919 | 21,025 |
| - = No Data Reported; -- = Not Applicable; NA = Not Available; W = Withheld to avoid disclosure of individual company data. |
| Release Date: 12/30/2022 |
| Next Release Date: NA |