|
Download Data (XLS File) |
|
|||||
|
|||||
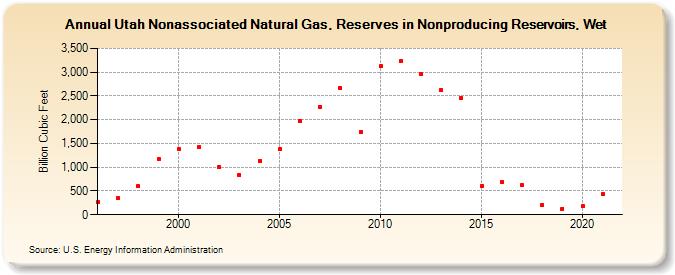
| Utah Nonassociated Natural Gas, Reserves in Nonproducing Reservoirs, Wet (Billion Cubic Feet) | |||||
| Decade | Year-0 | Year-1 | Year-2 | Year-3 | Year-4 | Year-5 | Year-6 | Year-7 | Year-8 | Year-9 |
|---|---|---|---|---|---|---|---|---|---|---|
| 1990's | 258 | 347 | 595 | 1,177 | ||||||
| 2000's | 1,377 | 1,423 | 1,002 | 840 | 1,136 | 1,379 | 1,978 | 2,272 | 2,670 | 1,739 |
| 2010's | 3,125 | 3,230 | 2,955 | 2,621 | 2,460 | 608 | 698 | 617 | 203 | 129 |
| 2020's | 181 | 427 |
| - = No Data Reported; -- = Not Applicable; NA = Not Available; W = Withheld to avoid disclosure of individual company data. |
| Release Date: 12/30/2022 |
| Next Release Date: NA |