|
Download Data (XLS File) |
|
|||||
|
|||||
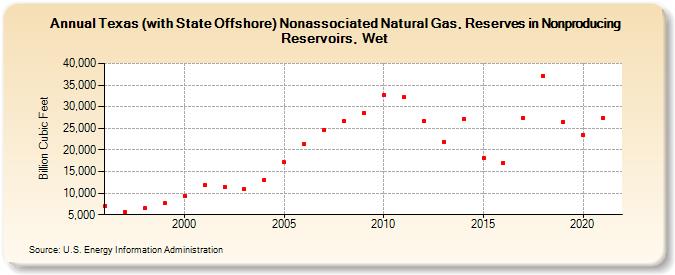
| Texas (with State Offshore) Nonassociated Natural Gas, Reserves in Nonproducing Reservoirs, Wet (Billion Cubic Feet) | |||||
| Decade | Year-0 | Year-1 | Year-2 | Year-3 | Year-4 | Year-5 | Year-6 | Year-7 | Year-8 | Year-9 |
|---|---|---|---|---|---|---|---|---|---|---|
| 1990's | 6,979 | 5,734 | 6,453 | 7,642 | ||||||
| 2000's | 9,421 | 11,771 | 11,441 | 10,869 | 13,084 | 17,096 | 21,461 | 24,549 | 26,644 | 28,549 |
| 2010's | 32,605 | 32,240 | 26,632 | 21,944 | 27,130 | 18,106 | 17,030 | 27,346 | 37,066 | 26,504 |
| 2020's | 23,507 | 27,334 |
| - = No Data Reported; -- = Not Applicable; NA = Not Available; W = Withheld to avoid disclosure of individual company data. |
| Release Date: 12/30/2022 |
| Next Release Date: NA |