|
Download Data (XLS File) |
|
|||||
|
|||||
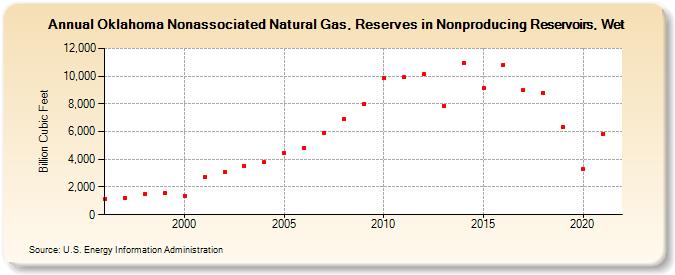
| Oklahoma Nonassociated Natural Gas, Reserves in Nonproducing Reservoirs, Wet (Billion Cubic Feet) | |||||
| Decade | Year-0 | Year-1 | Year-2 | Year-3 | Year-4 | Year-5 | Year-6 | Year-7 | Year-8 | Year-9 |
|---|---|---|---|---|---|---|---|---|---|---|
| 1990's | 1,158 | 1,219 | 1,499 | 1,559 | ||||||
| 2000's | 1,368 | 2,731 | 3,085 | 3,537 | 3,800 | 4,454 | 4,838 | 5,926 | 6,884 | 7,990 |
| 2010's | 9,856 | 9,935 | 10,145 | 7,878 | 10,953 | 9,142 | 10,823 | 8,976 | 8,814 | 6,332 |
| 2020's | 3,278 | 5,830 |
| - = No Data Reported; -- = Not Applicable; NA = Not Available; W = Withheld to avoid disclosure of individual company data. |
| Release Date: 12/30/2022 |
| Next Release Date: NA |