|
Download Data (XLS File) |
|
|||||
|
|||||
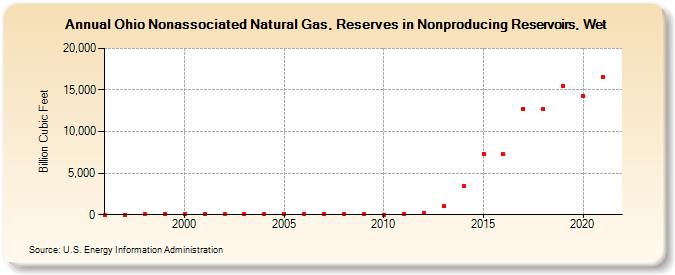
| Ohio Nonassociated Natural Gas, Reserves in Nonproducing Reservoirs, Wet (Billion Cubic Feet) | |||||
| Decade | Year-0 | Year-1 | Year-2 | Year-3 | Year-4 | Year-5 | Year-6 | Year-7 | Year-8 | Year-9 |
|---|---|---|---|---|---|---|---|---|---|---|
| 1990's | 19 | 6 | 38 | 142 | ||||||
| 2000's | 75 | 102 | 107 | 98 | 92 | 124 | 115 | 125 | 110 | 67 |
| 2010's | 14 | 50 | 246 | 1,015 | 3,498 | 7,359 | 7,284 | 12,741 | 12,770 | 15,477 |
| 2020's | 14,244 | 16,533 |
| - = No Data Reported; -- = Not Applicable; NA = Not Available; W = Withheld to avoid disclosure of individual company data. |
| Release Date: 12/30/2022 |
| Next Release Date: NA |