|
Download Data (XLS File) |
|
|||||
|
|||||
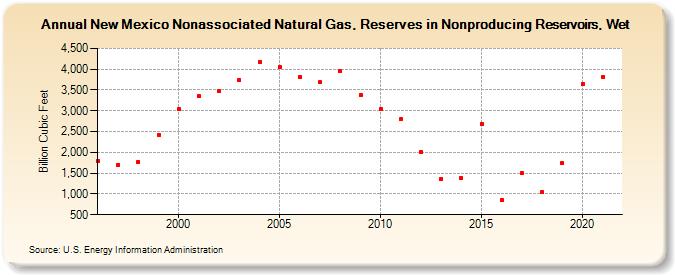
| New Mexico Nonassociated Natural Gas, Reserves in Nonproducing Reservoirs, Wet (Billion Cubic Feet) | |||||
| Decade | Year-0 | Year-1 | Year-2 | Year-3 | Year-4 | Year-5 | Year-6 | Year-7 | Year-8 | Year-9 |
|---|---|---|---|---|---|---|---|---|---|---|
| 1990's | 1,798 | 1,700 | 1,776 | 2,423 | ||||||
| 2000's | 3,036 | 3,350 | 3,472 | 3,745 | 4,169 | 4,049 | 3,814 | 3,682 | 3,955 | 3,376 |
| 2010's | 3,043 | 2,794 | 2,005 | 1,369 | 1,377 | 2,688 | 865 | 1,495 | 1,044 | 1,742 |
| 2020's | 3,638 | 3,815 |
| - = No Data Reported; -- = Not Applicable; NA = Not Available; W = Withheld to avoid disclosure of individual company data. |
| Release Date: 12/30/2022 |
| Next Release Date: NA |