|
Download Data (XLS File) |
|
|||||
|
|||||
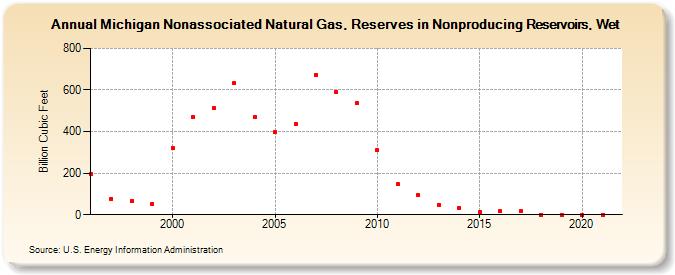
| Michigan Nonassociated Natural Gas, Reserves in Nonproducing Reservoirs, Wet (Billion Cubic Feet) | |||||
| Decade | Year-0 | Year-1 | Year-2 | Year-3 | Year-4 | Year-5 | Year-6 | Year-7 | Year-8 | Year-9 |
|---|---|---|---|---|---|---|---|---|---|---|
| 1990's | 197 | 77 | 68 | 52 | ||||||
| 2000's | 322 | 468 | 512 | 633 | 468 | 396 | 436 | 674 | 590 | 535 |
| 2010's | 311 | 146 | 95 | 48 | 34 | 14 | 16 | 16 | 0 | 0 |
| 2020's | 0 | 0 |
| - = No Data Reported; -- = Not Applicable; NA = Not Available; W = Withheld to avoid disclosure of individual company data. |
| Release Date: 12/30/2022 |
| Next Release Date: NA |