|
Download Data (XLS File) |
|
|||||
|
|||||
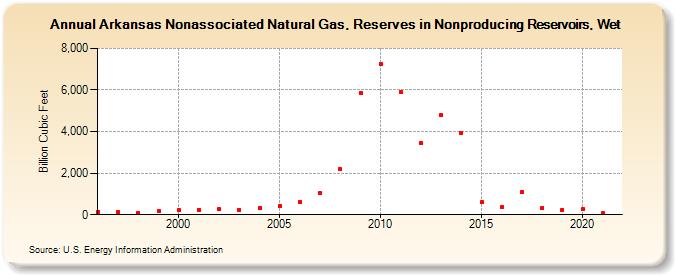
| Arkansas Nonassociated Natural Gas, Reserves in Nonproducing Reservoirs, Wet (Billion Cubic Feet) | |||||
| Decade | Year-0 | Year-1 | Year-2 | Year-3 | Year-4 | Year-5 | Year-6 | Year-7 | Year-8 | Year-9 |
|---|---|---|---|---|---|---|---|---|---|---|
| 1990's | 149 | 136 | 96 | 186 | ||||||
| 2000's | 207 | 247 | 254 | 243 | 315 | 410 | 615 | 1,045 | 2,182 | 5,872 |
| 2010's | 7,273 | 5,919 | 3,450 | 4,774 | 3,951 | 590 | 365 | 1,099 | 335 | 244 |
| 2020's | 252 | 60 |
| - = No Data Reported; -- = Not Applicable; NA = Not Available; W = Withheld to avoid disclosure of individual company data. |
| Release Date: 12/30/2022 |
| Next Release Date: NA |