|
Download Data (XLS File) |
|
|||||
|
|||||
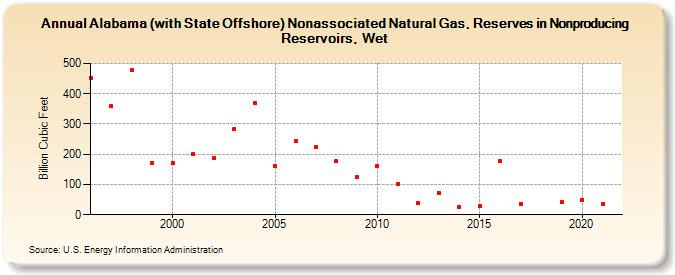
| Alabama (with State Offshore) Nonassociated Natural Gas, Reserves in Nonproducing Reservoirs, Wet (Billion Cubic Feet) | |||||
| Decade | Year-0 | Year-1 | Year-2 | Year-3 | Year-4 | Year-5 | Year-6 | Year-7 | Year-8 | Year-9 |
|---|---|---|---|---|---|---|---|---|---|---|
| 1990's | 452 | 359 | 477 | 172 | ||||||
| 2000's | 172 | 200 | 189 | 284 | 369 | 161 | 244 | 225 | 177 | 126 |
| 2010's | 162 | 101 | 38 | 71 | 26 | 28 | 177 | 35 | W | 43 |
| 2020's | 49 | 37 |
| - = No Data Reported; -- = Not Applicable; NA = Not Available; W = Withheld to avoid disclosure of individual company data. |
| Release Date: 12/30/2022 |
| Next Release Date: NA |