|
Download Data (XLS File) |
|
|||||
|
|||||
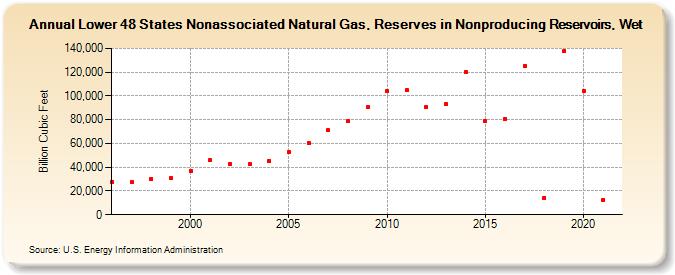
| Lower 48 States Nonassociated Natural Gas, Reserves in Nonproducing Reservoirs, Wet (Billion Cubic Feet) | |||||
| Decade | Year-0 | Year-1 | Year-2 | Year-3 | Year-4 | Year-5 | Year-6 | Year-7 | Year-8 | Year-9 |
|---|---|---|---|---|---|---|---|---|---|---|
| 1990's | 27,691 | 27,294 | 30,073 | 30,539 | ||||||
| 2000's | 37,068 | 45,737 | 42,831 | 42,474 | 45,332 | 52,845 | 60,330 | 70,887 | 78,632 | 90,304 |
| 2010's | 104,109 | 104,676 | 90,512 | 93,344 | 120,136 | 78,855 | 80,481 | 125,095 | 14,417 | 137,974 |
| 2020's | 104,450 | 12,654 |
| - = No Data Reported; -- = Not Applicable; NA = Not Available; W = Withheld to avoid disclosure of individual company data. |
| Release Date: 12/30/2022 |
| Next Release Date: NA |