|
Download Data (XLS File) |
|
|||||
|
|||||
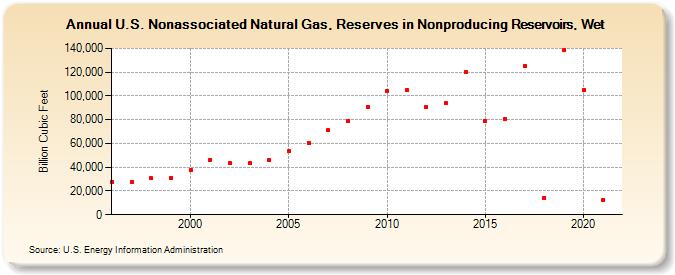
| U.S. Nonassociated Natural Gas, Reserves in Nonproducing Reservoirs, Wet (Billion Cubic Feet) | |||||
| Decade | Year-0 | Year-1 | Year-2 | Year-3 | Year-4 | Year-5 | Year-6 | Year-7 | Year-8 | Year-9 |
|---|---|---|---|---|---|---|---|---|---|---|
| 1990's | 27,760 | 27,526 | 30,570 | 31,235 | ||||||
| 2000's | 37,639 | 46,321 | 43,401 | 43,165 | 45,996 | 53,387 | 60,669 | 71,204 | 78,863 | 90,477 |
| 2010's | 104,340 | 104,964 | 90,801 | 93,697 | 120,492 | 79,156 | 80,851 | 125,560 | 14,418 | 138,629 |
| 2020's | 105,035 | 12,710 |
| - = No Data Reported; -- = Not Applicable; NA = Not Available; W = Withheld to avoid disclosure of individual company data. |
| Release Date: 12/30/2022 |
| Next Release Date: NA |