|
Download Data (XLS File) |
|
|||||
|
|||||
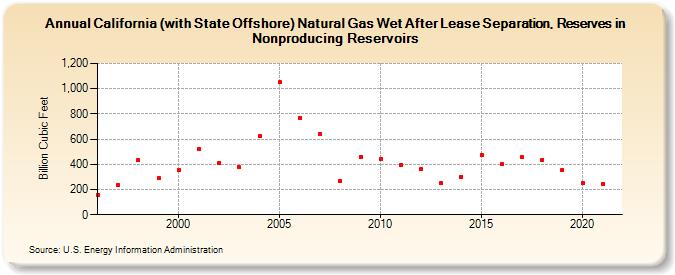
| California (with State Offshore) Natural Gas Wet After Lease Separation, Reserves in Nonproducing Reservoirs (Billion Cubic Feet) | |||||
| Decade | Year-0 | Year-1 | Year-2 | Year-3 | Year-4 | Year-5 | Year-6 | Year-7 | Year-8 | Year-9 |
|---|---|---|---|---|---|---|---|---|---|---|
| 1990's | 156 | 233 | 431 | 288 | ||||||
| 2000's | 358 | 518 | 414 | 376 | 624 | 1,050 | 770 | 641 | 267 | 460 |
| 2010's | 441 | 395 | 360 | 248 | 303 | 475 | 401 | 455 | 438 | 355 |
| 2020's | 253 | 247 |
| - = No Data Reported; -- = Not Applicable; NA = Not Available; W = Withheld to avoid disclosure of individual company data. |
| Release Date: 12/30/2022 |
| Next Release Date: NA |