|
Download Data (XLS File) |
|
|||||
|
|||||
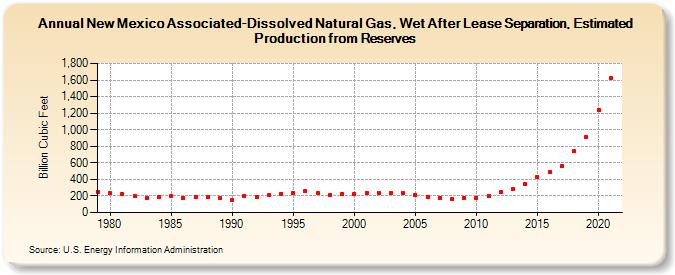
| New Mexico Associated-Dissolved Natural Gas, Wet After Lease Separation, Estimated Production from Reserves (Billion Cubic Feet) | |||||
| Decade | Year-0 | Year-1 | Year-2 | Year-3 | Year-4 | Year-5 | Year-6 | Year-7 | Year-8 | Year-9 |
|---|---|---|---|---|---|---|---|---|---|---|
| 1970's | 252 | |||||||||
| 1980's | 231 | 225 | 200 | 179 | 193 | 196 | 178 | 183 | 185 | 170 |
| 1990's | 157 | 201 | 191 | 207 | 229 | 241 | 258 | 232 | 216 | 225 |
| 2000's | 223 | 234 | 237 | 242 | 235 | 211 | 193 | 181 | 168 | 181 |
| 2010's | 181 | 204 | 250 | 284 | 343 | 431 | 494 | 568 | 739 | 915 |
| 2020's | 1,239 | 1,619 |
| - = No Data Reported; -- = Not Applicable; NA = Not Available; W = Withheld to avoid disclosure of individual company data. |
| Release Date: 12/30/2022 |
| Next Release Date: NA |