|
Download Data (XLS File) |
|
|||||
|
|||||
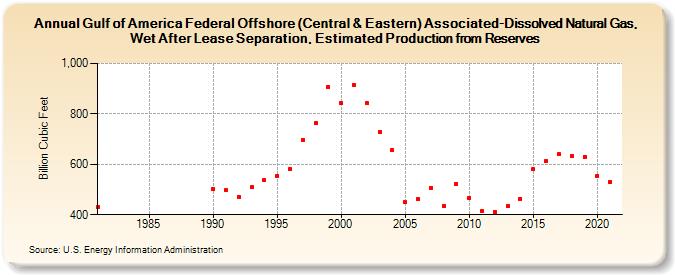
| Gulf of America Federal Offshore (Central & Eastern) Associated-Dissolved Natural Gas, Wet After Lease Separation, Estimated Production from Reserves (Billion Cubic Feet) | |||||
| Decade | Year-0 | Year-1 | Year-2 | Year-3 | Year-4 | Year-5 | Year-6 | Year-7 | Year-8 | Year-9 |
|---|---|---|---|---|---|---|---|---|---|---|
| 1980's | 432 | |||||||||
| 1990's | 502 | 497 | 471 | 508 | 536 | 554 | 581 | 697 | 763 | 906 |
| 2000's | 842 | 915 | 842 | 730 | 655 | 449 | 462 | 507 | 436 | 522 |
| 2010's | 468 | 415 | 411 | 435 | 464 | 580 | 613 | 639 | 631 | 630 |
| 2020's | 554 | 530 |
| - = No Data Reported; -- = Not Applicable; NA = Not Available; W = Withheld to avoid disclosure of individual company data. |
| Release Date: 12/30/2022 |
| Next Release Date: NA |