|
Download Data (XLS File) |
|
|||||
|
|||||
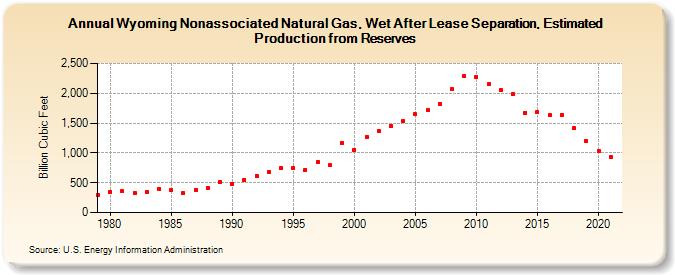
| Wyoming Nonassociated Natural Gas, Wet After Lease Separation, Estimated Production from Reserves (Billion Cubic Feet) | |||||
| Decade | Year-0 | Year-1 | Year-2 | Year-3 | Year-4 | Year-5 | Year-6 | Year-7 | Year-8 | Year-9 |
|---|---|---|---|---|---|---|---|---|---|---|
| 1970's | 295 | |||||||||
| 1980's | 352 | 354 | 334 | 346 | 400 | 381 | 325 | 385 | 411 | 510 |
| 1990's | 485 | 544 | 619 | 683 | 747 | 740 | 720 | 854 | 793 | 1,173 |
| 2000's | 1,050 | 1,275 | 1,375 | 1,458 | 1,537 | 1,648 | 1,714 | 1,828 | 2,066 | 2,288 |
| 2010's | 2,271 | 2,151 | 2,051 | 1,984 | 1,675 | 1,680 | 1,633 | 1,644 | 1,411 | 1,196 |
| 2020's | 1,035 | 935 |
| - = No Data Reported; -- = Not Applicable; NA = Not Available; W = Withheld to avoid disclosure of individual company data. |
| Release Date: 12/30/2022 |
| Next Release Date: NA |