|
Download Data (XLS File) |
|
|||||
|
|||||
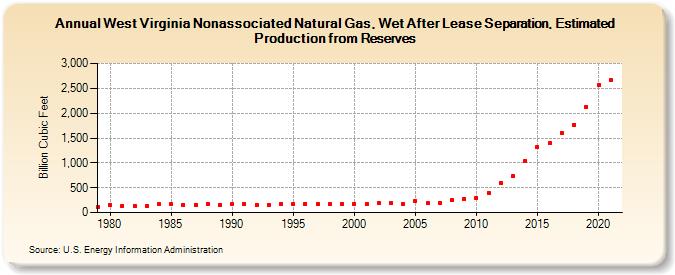
| West Virginia Nonassociated Natural Gas, Wet After Lease Separation, Estimated Production from Reserves (Billion Cubic Feet) | |||||
| Decade | Year-0 | Year-1 | Year-2 | Year-3 | Year-4 | Year-5 | Year-6 | Year-7 | Year-8 | Year-9 |
|---|---|---|---|---|---|---|---|---|---|---|
| 1970's | 120 | |||||||||
| 1980's | 154 | 141 | 138 | 129 | 168 | 168 | 156 | 162 | 170 | 162 |
| 1990's | 170 | 169 | 157 | 159 | 169 | 165 | 177 | 168 | 172 | 173 |
| 2000's | 178 | 164 | 201 | 193 | 174 | 234 | 192 | 197 | 254 | 282 |
| 2010's | 297 | 399 | 597 | 734 | 1,039 | 1,312 | 1,398 | 1,599 | 1,770 | 2,132 |
| 2020's | 2,559 | 2,665 |
| - = No Data Reported; -- = Not Applicable; NA = Not Available; W = Withheld to avoid disclosure of individual company data. |
| Release Date: 12/30/2022 |
| Next Release Date: NA |