|
Download Data (XLS File) |
|
|||||
|
|||||
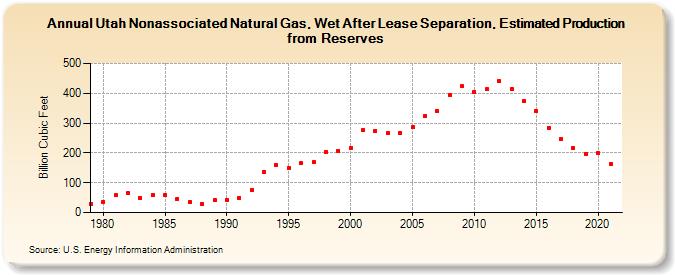
| Utah Nonassociated Natural Gas, Wet After Lease Separation, Estimated Production from Reserves (Billion Cubic Feet) | |||||
| Decade | Year-0 | Year-1 | Year-2 | Year-3 | Year-4 | Year-5 | Year-6 | Year-7 | Year-8 | Year-9 |
|---|---|---|---|---|---|---|---|---|---|---|
| 1970's | 29 | |||||||||
| 1980's | 37 | 58 | 65 | 49 | 59 | 59 | 46 | 36 | 30 | 41 |
| 1990's | 42 | 49 | 77 | 137 | 160 | 151 | 166 | 169 | 204 | 208 |
| 2000's | 218 | 276 | 275 | 266 | 268 | 286 | 323 | 340 | 393 | 423 |
| 2010's | 405 | 413 | 441 | 414 | 374 | 341 | 284 | 247 | 217 | 198 |
| 2020's | 199 | 164 |
| - = No Data Reported; -- = Not Applicable; NA = Not Available; W = Withheld to avoid disclosure of individual company data. |
| Release Date: 12/30/2022 |
| Next Release Date: NA |