|
Download Data (XLS File) |
|
|||||
|
|||||
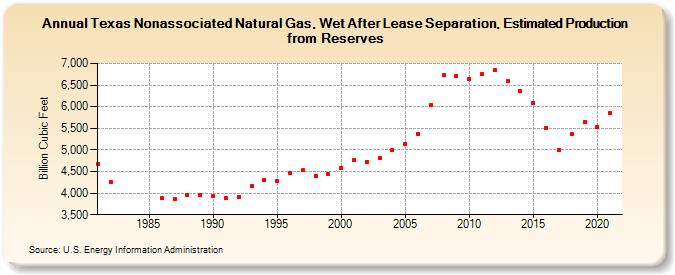
| Texas Nonassociated Natural Gas, Wet After Lease Separation, Estimated Production from Reserves (Billion Cubic Feet) | |||||
| Decade | Year-0 | Year-1 | Year-2 | Year-3 | Year-4 | Year-5 | Year-6 | Year-7 | Year-8 | Year-9 |
|---|---|---|---|---|---|---|---|---|---|---|
| 1980's | 4,672 | 4,265 | 3,877 | 3,860 | 3,966 | 3,954 | ||||
| 1990's | 3,928 | 3,879 | 3,917 | 4,161 | 4,296 | 4,284 | 4,466 | 4,525 | 4,396 | 4,438 |
| 2000's | 4,577 | 4,776 | 4,727 | 4,815 | 4,992 | 5,146 | 5,370 | 6,029 | 6,729 | 6,716 |
| 2010's | 6,641 | 6,748 | 6,840 | 6,585 | 6,355 | 6,080 | 5,502 | 4,989 | 5,366 | 5,640 |
| 2020's | 5,528 | 5,864 |
| - = No Data Reported; -- = Not Applicable; NA = Not Available; W = Withheld to avoid disclosure of individual company data. |
| Release Date: 12/30/2022 |
| Next Release Date: NA |