|
Download Data (XLS File) |
|
|||||
|
|||||
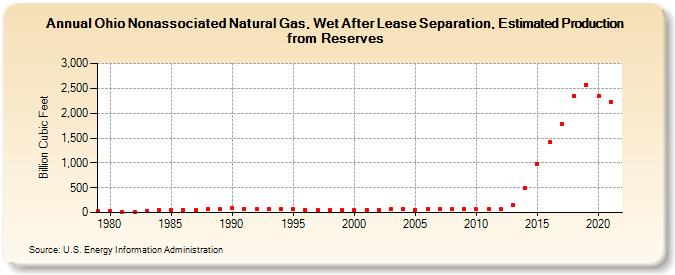
| Ohio Nonassociated Natural Gas, Wet After Lease Separation, Estimated Production from Reserves (Billion Cubic Feet) | |||||
| Decade | Year-0 | Year-1 | Year-2 | Year-3 | Year-4 | Year-5 | Year-6 | Year-7 | Year-8 | Year-9 |
|---|---|---|---|---|---|---|---|---|---|---|
| 1970's | 32 | |||||||||
| 1980's | 26 | 19 | 19 | 30 | 51 | 51 | 47 | 45 | 69 | 62 |
| 1990's | 83 | 77 | 68 | 67 | 79 | 67 | 57 | 48 | 42 | 52 |
| 2000's | 48 | 48 | 60 | 62 | 63 | 61 | 63 | 63 | 70 | 69 |
| 2010's | 65 | 68 | 65 | 144 | 486 | 978 | 1,412 | 1,773 | 2,354 | 2,576 |
| 2020's | 2,340 | 2,234 |
| - = No Data Reported; -- = Not Applicable; NA = Not Available; W = Withheld to avoid disclosure of individual company data. |
| Release Date: 12/30/2022 |
| Next Release Date: NA |