|
Download Data (XLS File) |
|
|||||
|
|||||
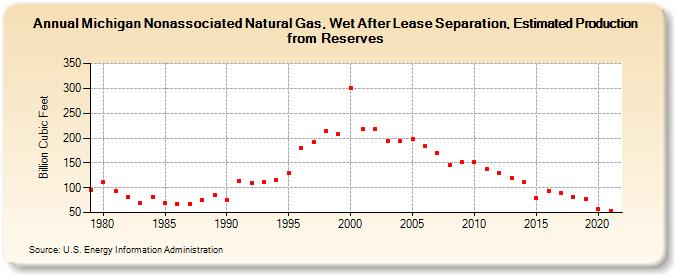
| Michigan Nonassociated Natural Gas, Wet After Lease Separation, Estimated Production from Reserves (Billion Cubic Feet) | |||||
| Decade | Year-0 | Year-1 | Year-2 | Year-3 | Year-4 | Year-5 | Year-6 | Year-7 | Year-8 | Year-9 |
|---|---|---|---|---|---|---|---|---|---|---|
| 1970's | 96 | |||||||||
| 1980's | 111 | 94 | 81 | 69 | 81 | 69 | 68 | 68 | 76 | 85 |
| 1990's | 76 | 114 | 110 | 111 | 115 | 130 | 179 | 192 | 215 | 208 |
| 2000's | 300 | 218 | 218 | 195 | 194 | 198 | 183 | 170 | 145 | 151 |
| 2010's | 151 | 137 | 130 | 120 | 112 | 79 | 94 | 90 | 81 | 78 |
| 2020's | 57 | 53 |
| - = No Data Reported; -- = Not Applicable; NA = Not Available; W = Withheld to avoid disclosure of individual company data. |
| Release Date: 12/30/2022 |
| Next Release Date: NA |