|
Download Data (XLS File) |
|
|||||
|
|||||
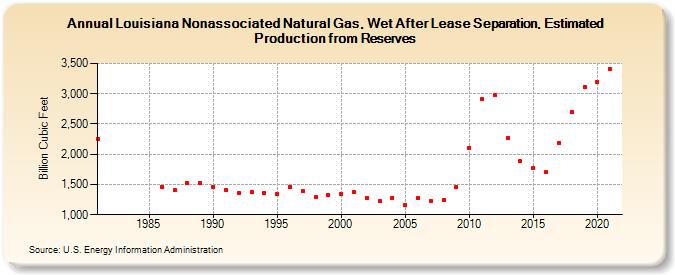
| Louisiana Nonassociated Natural Gas, Wet After Lease Separation, Estimated Production from Reserves (Billion Cubic Feet) | |||||
| Decade | Year-0 | Year-1 | Year-2 | Year-3 | Year-4 | Year-5 | Year-6 | Year-7 | Year-8 | Year-9 |
|---|---|---|---|---|---|---|---|---|---|---|
| 1980's | 2,254 | 1,464 | 1,404 | 1,525 | 1,522 | |||||
| 1990's | 1,464 | 1,412 | 1,358 | 1,375 | 1,363 | 1,346 | 1,459 | 1,386 | 1,285 | 1,323 |
| 2000's | 1,348 | 1,379 | 1,283 | 1,227 | 1,283 | 1,167 | 1,282 | 1,230 | 1,246 | 1,462 |
| 2010's | 2,107 | 2,909 | 2,974 | 2,268 | 1,880 | 1,775 | 1,702 | 2,186 | 2,693 | 3,113 |
| 2020's | 3,198 | 3,409 |
| - = No Data Reported; -- = Not Applicable; NA = Not Available; W = Withheld to avoid disclosure of individual company data. |
| Release Date: 12/30/2022 |
| Next Release Date: NA |