|
Download Data (XLS File) |
|
|||||
|
|||||
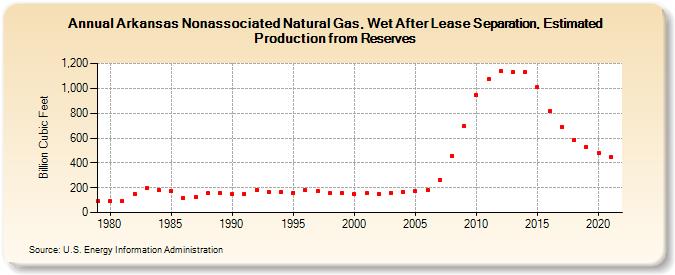
| Arkansas Nonassociated Natural Gas, Wet After Lease Separation, Estimated Production from Reserves (Billion Cubic Feet) | |||||
| Decade | Year-0 | Year-1 | Year-2 | Year-3 | Year-4 | Year-5 | Year-6 | Year-7 | Year-8 | Year-9 |
|---|---|---|---|---|---|---|---|---|---|---|
| 1970's | 91 | |||||||||
| 1980's | 90 | 94 | 150 | 196 | 178 | 173 | 119 | 124 | 154 | 161 |
| 1990's | 152 | 152 | 180 | 167 | 167 | 160 | 178 | 173 | 157 | 159 |
| 2000's | 150 | 157 | 153 | 161 | 166 | 171 | 183 | 265 | 454 | 694 |
| 2010's | 948 | 1,074 | 1,143 | 1,132 | 1,133 | 1,007 | 816 | 691 | 588 | 530 |
| 2020's | 478 | 446 |
| - = No Data Reported; -- = Not Applicable; NA = Not Available; W = Withheld to avoid disclosure of individual company data. |
| Release Date: 12/30/2022 |
| Next Release Date: NA |