|
Download Data (XLS File) |
|
|||||
|
|||||
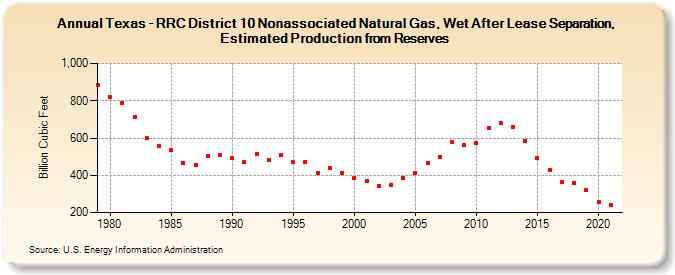
| Texas - RRC District 10 Nonassociated Natural Gas, Wet After Lease Separation, Estimated Production from Reserves (Billion Cubic Feet) | |||||
| Decade | Year-0 | Year-1 | Year-2 | Year-3 | Year-4 | Year-5 | Year-6 | Year-7 | Year-8 | Year-9 |
|---|---|---|---|---|---|---|---|---|---|---|
| 1970's | 882 | |||||||||
| 1980's | 821 | 789 | 711 | 600 | 556 | 534 | 468 | 456 | 501 | 507 |
| 1990's | 491 | 474 | 516 | 484 | 511 | 471 | 474 | 411 | 439 | 410 |
| 2000's | 386 | 368 | 345 | 347 | 387 | 414 | 468 | 498 | 581 | 562 |
| 2010's | 573 | 655 | 681 | 657 | 584 | 493 | 431 | 363 | 361 | 319 |
| 2020's | 259 | 238 |
| - = No Data Reported; -- = Not Applicable; NA = Not Available; W = Withheld to avoid disclosure of individual company data. |
| Release Date: 12/30/2022 |
| Next Release Date: NA |