|
Download Data (XLS File) |
|
|||||
|
|||||
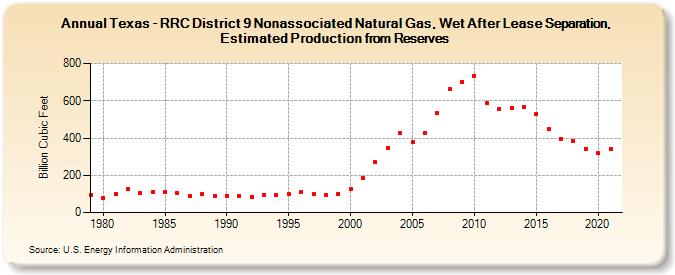
| Texas - RRC District 9 Nonassociated Natural Gas, Wet After Lease Separation, Estimated Production from Reserves (Billion Cubic Feet) | |||||
| Decade | Year-0 | Year-1 | Year-2 | Year-3 | Year-4 | Year-5 | Year-6 | Year-7 | Year-8 | Year-9 |
|---|---|---|---|---|---|---|---|---|---|---|
| 1970's | 95 | |||||||||
| 1980's | 79 | 102 | 126 | 103 | 109 | 113 | 105 | 89 | 100 | 89 |
| 1990's | 91 | 90 | 84 | 96 | 94 | 100 | 108 | 100 | 95 | 101 |
| 2000's | 128 | 186 | 269 | 348 | 425 | 376 | 428 | 534 | 662 | 702 |
| 2010's | 731 | 588 | 555 | 563 | 566 | 529 | 449 | 393 | 383 | 343 |
| 2020's | 317 | 341 |
| - = No Data Reported; -- = Not Applicable; NA = Not Available; W = Withheld to avoid disclosure of individual company data. |
| Release Date: 12/30/2022 |
| Next Release Date: NA |