|
Download Data (XLS File) |
|
|||||
|
|||||
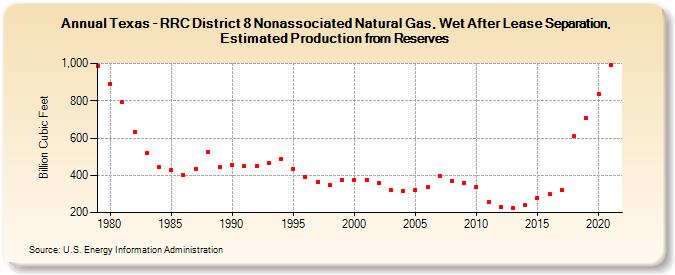
| Texas - RRC District 8 Nonassociated Natural Gas, Wet After Lease Separation, Estimated Production from Reserves (Billion Cubic Feet) | |||||
| Decade | Year-0 | Year-1 | Year-2 | Year-3 | Year-4 | Year-5 | Year-6 | Year-7 | Year-8 | Year-9 |
|---|---|---|---|---|---|---|---|---|---|---|
| 1970's | 989 | |||||||||
| 1980's | 890 | 791 | 634 | 517 | 442 | 427 | 399 | 436 | 525 | 445 |
| 1990's | 457 | 452 | 449 | 466 | 487 | 436 | 392 | 363 | 349 | 375 |
| 2000's | 375 | 375 | 361 | 321 | 318 | 322 | 337 | 395 | 372 | 359 |
| 2010's | 336 | 256 | 230 | 227 | 239 | 280 | 297 | 320 | 609 | 707 |
| 2020's | 837 | 993 |
| - = No Data Reported; -- = Not Applicable; NA = Not Available; W = Withheld to avoid disclosure of individual company data. |
| Release Date: 12/30/2022 |
| Next Release Date: NA |