|
Download Data (XLS File) |
|
|||||
|
|||||
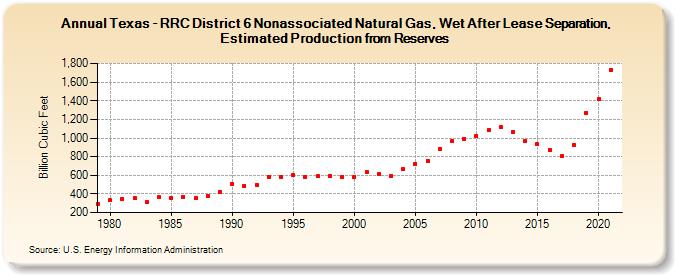
| Texas - RRC District 6 Nonassociated Natural Gas, Wet After Lease Separation, Estimated Production from Reserves (Billion Cubic Feet) | |||||
| Decade | Year-0 | Year-1 | Year-2 | Year-3 | Year-4 | Year-5 | Year-6 | Year-7 | Year-8 | Year-9 |
|---|---|---|---|---|---|---|---|---|---|---|
| 1970's | 297 | |||||||||
| 1980's | 331 | 343 | 355 | 310 | 362 | 353 | 372 | 356 | 377 | 421 |
| 1990's | 508 | 489 | 501 | 585 | 584 | 600 | 586 | 589 | 594 | 586 |
| 2000's | 586 | 633 | 611 | 595 | 667 | 725 | 757 | 887 | 971 | 990 |
| 2010's | 1,020 | 1,085 | 1,113 | 1,067 | 969 | 932 | 872 | 807 | 930 | 1,273 |
| 2020's | 1,414 | 1,731 |
| - = No Data Reported; -- = Not Applicable; NA = Not Available; W = Withheld to avoid disclosure of individual company data. |
| Release Date: 12/30/2022 |
| Next Release Date: NA |