|
Download Data (XLS File) |
|
|||||
|
|||||
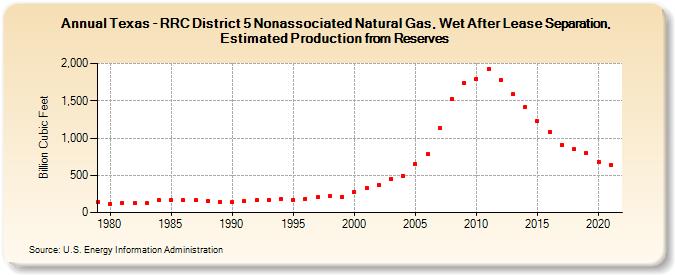
| Texas - RRC District 5 Nonassociated Natural Gas, Wet After Lease Separation, Estimated Production from Reserves (Billion Cubic Feet) | |||||
| Decade | Year-0 | Year-1 | Year-2 | Year-3 | Year-4 | Year-5 | Year-6 | Year-7 | Year-8 | Year-9 |
|---|---|---|---|---|---|---|---|---|---|---|
| 1970's | 146 | |||||||||
| 1980's | 120 | 132 | 125 | 124 | 163 | 167 | 162 | 163 | 153 | 144 |
| 1990's | 145 | 158 | 165 | 170 | 180 | 167 | 187 | 204 | 217 | 210 |
| 2000's | 279 | 329 | 373 | 454 | 488 | 648 | 780 | 1,128 | 1,530 | 1,735 |
| 2010's | 1,795 | 1,924 | 1,778 | 1,585 | 1,419 | 1,222 | 1,083 | 913 | 848 | 797 |
| 2020's | 683 | 639 |
| - = No Data Reported; -- = Not Applicable; NA = Not Available; W = Withheld to avoid disclosure of individual company data. |
| Release Date: 12/30/2022 |
| Next Release Date: NA |