|
Download Data (XLS File) |
|
|||||
|
|||||
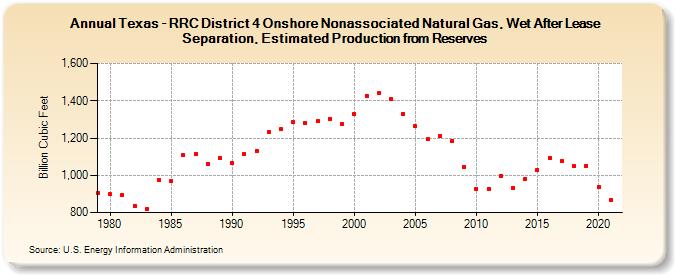
| Texas - RRC District 4 Onshore Nonassociated Natural Gas, Wet After Lease Separation, Estimated Production from Reserves (Billion Cubic Feet) | |||||
| Decade | Year-0 | Year-1 | Year-2 | Year-3 | Year-4 | Year-5 | Year-6 | Year-7 | Year-8 | Year-9 |
|---|---|---|---|---|---|---|---|---|---|---|
| 1970's | 906 | |||||||||
| 1980's | 897 | 895 | 837 | 817 | 977 | 967 | 1,107 | 1,116 | 1,061 | 1,094 |
| 1990's | 1,066 | 1,115 | 1,133 | 1,230 | 1,248 | 1,286 | 1,280 | 1,291 | 1,304 | 1,277 |
| 2000's | 1,330 | 1,427 | 1,439 | 1,408 | 1,331 | 1,262 | 1,193 | 1,210 | 1,185 | 1,043 |
| 2010's | 927 | 928 | 997 | 934 | 982 | 1,029 | 1,093 | 1,077 | 1,051 | 1,052 |
| 2020's | 937 | 869 |
| - = No Data Reported; -- = Not Applicable; NA = Not Available; W = Withheld to avoid disclosure of individual company data. |
| Release Date: 12/30/2022 |
| Next Release Date: NA |