|
Download Data (XLS File) |
|
|||||
|
|||||
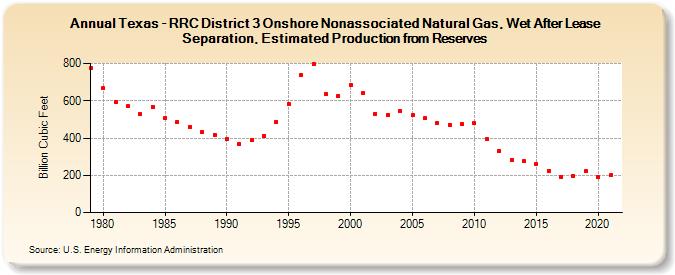
| Texas - RRC District 3 Onshore Nonassociated Natural Gas, Wet After Lease Separation, Estimated Production from Reserves (Billion Cubic Feet) | |||||
| Decade | Year-0 | Year-1 | Year-2 | Year-3 | Year-4 | Year-5 | Year-6 | Year-7 | Year-8 | Year-9 |
|---|---|---|---|---|---|---|---|---|---|---|
| 1970's | 775 | |||||||||
| 1980's | 666 | 593 | 571 | 527 | 569 | 505 | 485 | 460 | 432 | 418 |
| 1990's | 393 | 368 | 388 | 412 | 488 | 583 | 739 | 795 | 636 | 627 |
| 2000's | 686 | 639 | 531 | 524 | 543 | 523 | 505 | 481 | 471 | 475 |
| 2010's | 479 | 394 | 331 | 284 | 275 | 259 | 225 | 190 | 195 | 221 |
| 2020's | 190 | 200 |
| - = No Data Reported; -- = Not Applicable; NA = Not Available; W = Withheld to avoid disclosure of individual company data. |
| Release Date: 12/30/2022 |
| Next Release Date: NA |