|
Download Data (XLS File) |
|
|||||
|
|||||
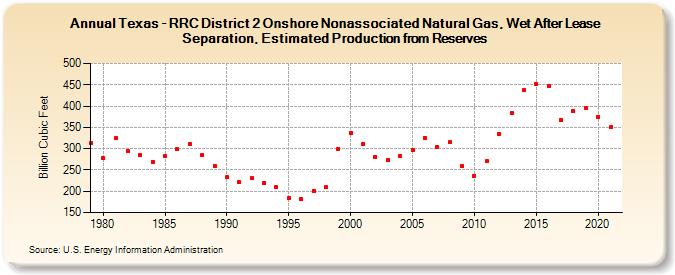
| Texas - RRC District 2 Onshore Nonassociated Natural Gas, Wet After Lease Separation, Estimated Production from Reserves (Billion Cubic Feet) | |||||
| Decade | Year-0 | Year-1 | Year-2 | Year-3 | Year-4 | Year-5 | Year-6 | Year-7 | Year-8 | Year-9 |
|---|---|---|---|---|---|---|---|---|---|---|
| 1970's | 313 | |||||||||
| 1980's | 277 | 324 | 294 | 285 | 269 | 283 | 299 | 311 | 285 | 260 |
| 1990's | 233 | 221 | 230 | 220 | 210 | 184 | 181 | 201 | 210 | 300 |
| 2000's | 337 | 311 | 281 | 273 | 283 | 298 | 326 | 304 | 315 | 259 |
| 2010's | 237 | 270 | 334 | 384 | 438 | 451 | 448 | 367 | 389 | 396 |
| 2020's | 375 | 350 |
| - = No Data Reported; -- = Not Applicable; NA = Not Available; W = Withheld to avoid disclosure of individual company data. |
| Release Date: 12/30/2022 |
| Next Release Date: NA |