|
Download Data (XLS File) |
|
|||||
|
|||||
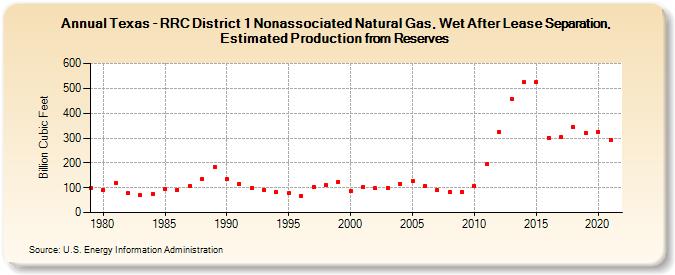
| Texas - RRC District 1 Nonassociated Natural Gas, Wet After Lease Separation, Estimated Production from Reserves (Billion Cubic Feet) | |||||
| Decade | Year-0 | Year-1 | Year-2 | Year-3 | Year-4 | Year-5 | Year-6 | Year-7 | Year-8 | Year-9 |
|---|---|---|---|---|---|---|---|---|---|---|
| 1970's | 100 | |||||||||
| 1980's | 91 | 119 | 77 | 70 | 75 | 94 | 92 | 107 | 136 | 185 |
| 1990's | 135 | 116 | 98 | 91 | 82 | 77 | 68 | 104 | 110 | 124 |
| 2000's | 85 | 103 | 97 | 99 | 116 | 126 | 107 | 89 | 82 | 84 |
| 2010's | 107 | 195 | 326 | 458 | 524 | 526 | 302 | 304 | 344 | 321 |
| 2020's | 326 | 294 |
| - = No Data Reported; -- = Not Applicable; NA = Not Available; W = Withheld to avoid disclosure of individual company data. |
| Release Date: 12/30/2022 |
| Next Release Date: NA |