|
Download Data (XLS File) |
|
|||||
|
|||||
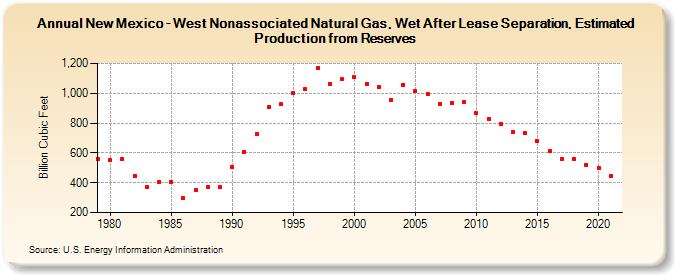
| New Mexico - West Nonassociated Natural Gas, Wet After Lease Separation, Estimated Production from Reserves (Billion Cubic Feet) | |||||
| Decade | Year-0 | Year-1 | Year-2 | Year-3 | Year-4 | Year-5 | Year-6 | Year-7 | Year-8 | Year-9 |
|---|---|---|---|---|---|---|---|---|---|---|
| 1970's | 561 | |||||||||
| 1980's | 555 | 560 | 447 | 373 | 406 | 407 | 297 | 353 | 372 | 371 |
| 1990's | 508 | 607 | 729 | 906 | 925 | 1,003 | 1,026 | 1,170 | 1,064 | 1,094 |
| 2000's | 1,106 | 1,063 | 1,043 | 956 | 1,059 | 1,016 | 992 | 930 | 934 | 939 |
| 2010's | 866 | 828 | 796 | 738 | 733 | 678 | 614 | 562 | 556 | 522 |
| 2020's | 500 | 447 |
| - = No Data Reported; -- = Not Applicable; NA = Not Available; W = Withheld to avoid disclosure of individual company data. |
| Release Date: 12/30/2022 |
| Next Release Date: NA |