|
Download Data (XLS File) |
|
|||||
|
|||||
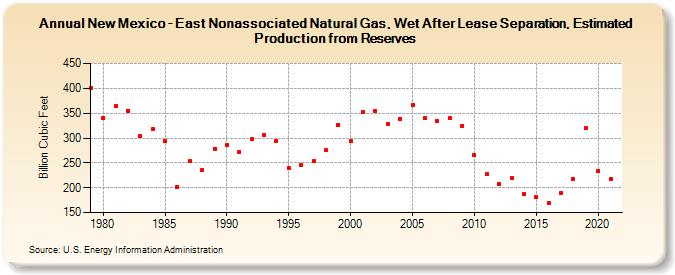
| New Mexico - East Nonassociated Natural Gas, Wet After Lease Separation, Estimated Production from Reserves (Billion Cubic Feet) | |||||
| Decade | Year-0 | Year-1 | Year-2 | Year-3 | Year-4 | Year-5 | Year-6 | Year-7 | Year-8 | Year-9 |
|---|---|---|---|---|---|---|---|---|---|---|
| 1970's | 400 | |||||||||
| 1980's | 341 | 365 | 355 | 304 | 318 | 293 | 202 | 254 | 236 | 278 |
| 1990's | 286 | 272 | 298 | 306 | 295 | 239 | 246 | 253 | 275 | 327 |
| 2000's | 294 | 352 | 354 | 328 | 338 | 367 | 340 | 334 | 340 | 325 |
| 2010's | 265 | 228 | 208 | 220 | 187 | 181 | 170 | 189 | 217 | 321 |
| 2020's | 234 | 217 |
| - = No Data Reported; -- = Not Applicable; NA = Not Available; W = Withheld to avoid disclosure of individual company data. |
| Release Date: 12/30/2022 |
| Next Release Date: NA |