|
Download Data (XLS File) |
|
|||||
|
|||||
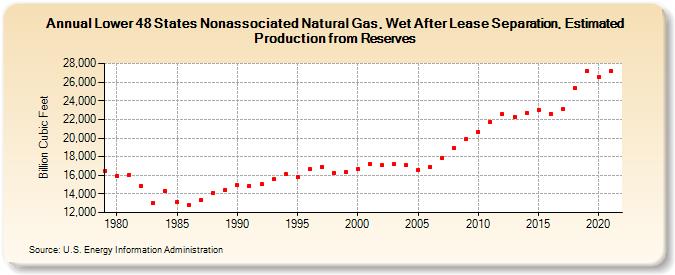
| Lower 48 States Nonassociated Natural Gas, Wet After Lease Separation, Estimated Production from Reserves (Billion Cubic Feet) | |||||
| Decade | Year-0 | Year-1 | Year-2 | Year-3 | Year-4 | Year-5 | Year-6 | Year-7 | Year-8 | Year-9 |
|---|---|---|---|---|---|---|---|---|---|---|
| 1970's | 16,498 | |||||||||
| 1980's | 15,934 | 16,057 | 14,856 | 13,042 | 14,325 | 13,144 | 12,779 | 13,374 | 14,090 | 14,461 |
| 1990's | 14,909 | 14,860 | 15,019 | 15,589 | 16,102 | 15,793 | 16,634 | 16,905 | 16,282 | 16,341 |
| 2000's | 16,665 | 17,238 | 17,060 | 17,172 | 17,069 | 16,614 | 16,900 | 17,858 | 18,917 | 19,845 |
| 2010's | 20,634 | 21,747 | 22,575 | 22,245 | 22,716 | 23,042 | 22,614 | 23,080 | 25,350 | 27,180 |
| 2020's | 26,588 | 27,175 |
| - = No Data Reported; -- = Not Applicable; NA = Not Available; W = Withheld to avoid disclosure of individual company data. |
| Release Date: 12/30/2022 |
| Next Release Date: NA |