|
Download Data (XLS File) |
|
|||||
|
|||||
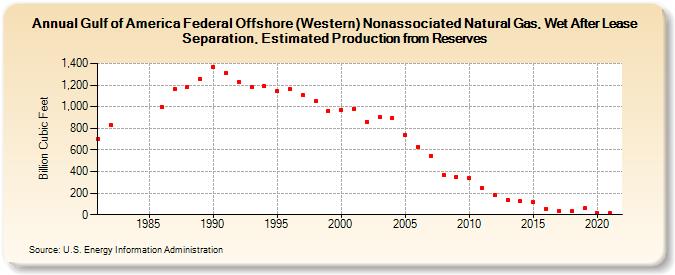
| Gulf of America Federal Offshore (Western) Nonassociated Natural Gas, Wet After Lease Separation, Estimated Production from Reserves (Billion Cubic Feet) | |||||
| Decade | Year-0 | Year-1 | Year-2 | Year-3 | Year-4 | Year-5 | Year-6 | Year-7 | Year-8 | Year-9 |
|---|---|---|---|---|---|---|---|---|---|---|
| 1980's | 700 | 830 | 1,000 | 1,163 | 1,186 | 1,256 | ||||
| 1990's | 1,372 | 1,313 | 1,231 | 1,178 | 1,189 | 1,143 | 1,162 | 1,104 | 1,049 | 964 |
| 2000's | 972 | 981 | 862 | 900 | 897 | 740 | 630 | 548 | 372 | 353 |
| 2010's | 341 | 250 | 184 | 140 | 124 | 116 | 57 | 38 | 31 | 59 |
| 2020's | 15 | 12 |
| - = No Data Reported; -- = Not Applicable; NA = Not Available; W = Withheld to avoid disclosure of individual company data. |
| Release Date: 12/30/2022 |
| Next Release Date: NA |