|
Download Data (XLS File) |
|
|||||
|
|||||
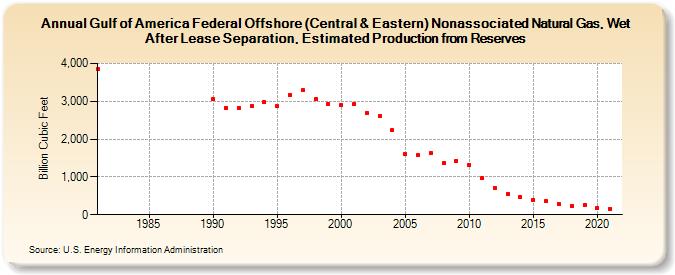
| Gulf of America Federal Offshore (Central & Eastern) Nonassociated Natural Gas, Wet After Lease Separation, Estimated Production from Reserves (Billion Cubic Feet) | |||||
| Decade | Year-0 | Year-1 | Year-2 | Year-3 | Year-4 | Year-5 | Year-6 | Year-7 | Year-8 | Year-9 |
|---|---|---|---|---|---|---|---|---|---|---|
| 1980's | 3,853 | |||||||||
| 1990's | 3,066 | 2,835 | 2,821 | 2,875 | 2,969 | 2,867 | 3,171 | 3,287 | 3,054 | 2,923 |
| 2000's | 2,905 | 2,928 | 2,698 | 2,600 | 2,235 | 1,607 | 1,574 | 1,628 | 1,371 | 1,425 |
| 2010's | 1,318 | 960 | 710 | 551 | 468 | 387 | 354 | 274 | 226 | 251 |
| 2020's | 169 | 162 |
| - = No Data Reported; -- = Not Applicable; NA = Not Available; W = Withheld to avoid disclosure of individual company data. |
| Release Date: 12/30/2022 |
| Next Release Date: NA |