|
Download Data (XLS File) |
|
|||||
|
|||||
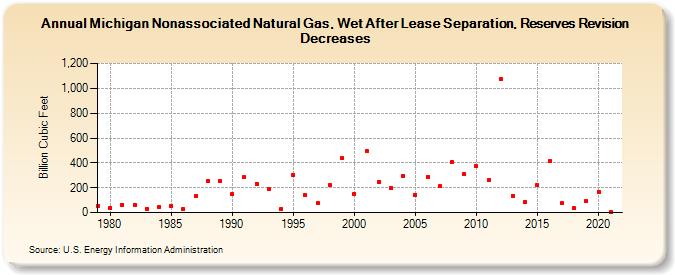
| Michigan Nonassociated Natural Gas, Wet After Lease Separation, Reserves Revision Decreases (Billion Cubic Feet) | |||||
| Decade | Year-0 | Year-1 | Year-2 | Year-3 | Year-4 | Year-5 | Year-6 | Year-7 | Year-8 | Year-9 |
|---|---|---|---|---|---|---|---|---|---|---|
| 1970's | 55 | |||||||||
| 1980's | 37 | 64 | 61 | 31 | 47 | 55 | 28 | 132 | 256 | 251 |
| 1990's | 150 | 285 | 233 | 190 | 29 | 303 | 139 | 74 | 218 | 441 |
| 2000's | 152 | 493 | 248 | 197 | 298 | 142 | 290 | 210 | 407 | 307 |
| 2010's | 372 | 260 | 1,073 | 137 | 85 | 219 | 414 | 73 | 33 | 94 |
| 2020's | 166 | 5 |
| - = No Data Reported; -- = Not Applicable; NA = Not Available; W = Withheld to avoid disclosure of individual company data. |
| Release Date: 12/30/2022 |
| Next Release Date: NA |