|
Download Data (XLS File) |
|
|||||
|
|||||
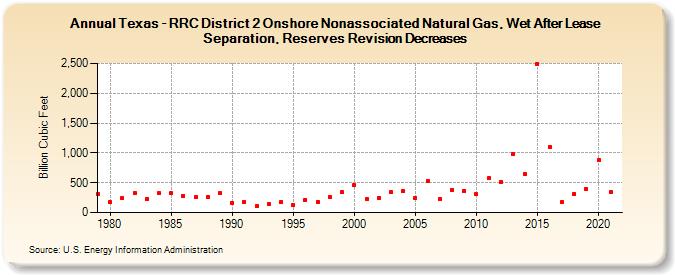
| Texas - RRC District 2 Onshore Nonassociated Natural Gas, Wet After Lease Separation, Reserves Revision Decreases (Billion Cubic Feet) | |||||
| Decade | Year-0 | Year-1 | Year-2 | Year-3 | Year-4 | Year-5 | Year-6 | Year-7 | Year-8 | Year-9 |
|---|---|---|---|---|---|---|---|---|---|---|
| 1970's | 317 | |||||||||
| 1980's | 180 | 236 | 325 | 235 | 322 | 323 | 281 | 255 | 261 | 324 |
| 1990's | 167 | 173 | 107 | 138 | 174 | 124 | 216 | 184 | 257 | 337 |
| 2000's | 455 | 230 | 244 | 342 | 355 | 249 | 530 | 220 | 384 | 364 |
| 2010's | 308 | 572 | 516 | 990 | 642 | 2,484 | 1,107 | 178 | 316 | 397 |
| 2020's | 876 | 337 |
| - = No Data Reported; -- = Not Applicable; NA = Not Available; W = Withheld to avoid disclosure of individual company data. |
| Release Date: 12/30/2022 |
| Next Release Date: NA |