|
Download Data (XLS File) |
|
|||||
|
|||||
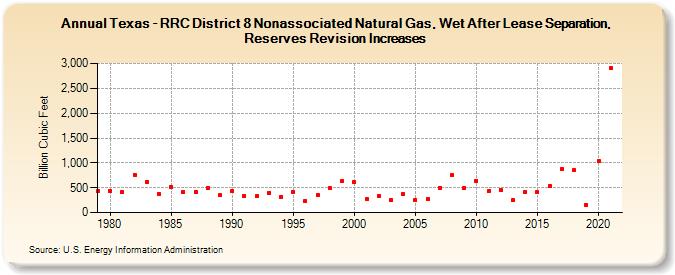
| Texas - RRC District 8 Nonassociated Natural Gas, Wet After Lease Separation, Reserves Revision Increases (Billion Cubic Feet) | |||||
| Decade | Year-0 | Year-1 | Year-2 | Year-3 | Year-4 | Year-5 | Year-6 | Year-7 | Year-8 | Year-9 |
|---|---|---|---|---|---|---|---|---|---|---|
| 1970's | 427 | |||||||||
| 1980's | 439 | 415 | 761 | 621 | 376 | 521 | 423 | 421 | 497 | 344 |
| 1990's | 437 | 330 | 326 | 398 | 322 | 420 | 235 | 355 | 486 | 632 |
| 2000's | 609 | 277 | 343 | 257 | 366 | 253 | 277 | 501 | 750 | 491 |
| 2010's | 642 | 431 | 451 | 247 | 411 | 407 | 544 | 880 | 854 | 154 |
| 2020's | 1,033 | 2,907 |
| - = No Data Reported; -- = Not Applicable; NA = Not Available; W = Withheld to avoid disclosure of individual company data. |
| Release Date: 12/30/2022 |
| Next Release Date: NA |