|
Download Data (XLS File) |
|
|||||
|
|||||
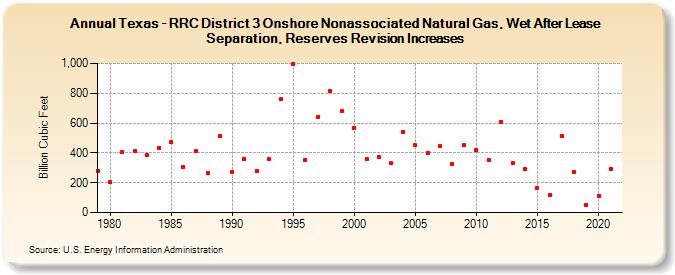
| Texas - RRC District 3 Onshore Nonassociated Natural Gas, Wet After Lease Separation, Reserves Revision Increases (Billion Cubic Feet) | |||||
| Decade | Year-0 | Year-1 | Year-2 | Year-3 | Year-4 | Year-5 | Year-6 | Year-7 | Year-8 | Year-9 |
|---|---|---|---|---|---|---|---|---|---|---|
| 1970's | 282 | |||||||||
| 1980's | 202 | 403 | 416 | 384 | 435 | 473 | 307 | 414 | 266 | 512 |
| 1990's | 275 | 357 | 279 | 356 | 763 | 998 | 355 | 643 | 816 | 679 |
| 2000's | 565 | 358 | 376 | 332 | 542 | 453 | 401 | 445 | 324 | 456 |
| 2010's | 419 | 355 | 608 | 335 | 290 | 167 | 119 | 514 | 270 | 54 |
| 2020's | 111 | 294 |
| - = No Data Reported; -- = Not Applicable; NA = Not Available; W = Withheld to avoid disclosure of individual company data. |
| Release Date: 12/30/2022 |
| Next Release Date: NA |