|
Download Data (XLS File) |
|
|||||
|
|||||
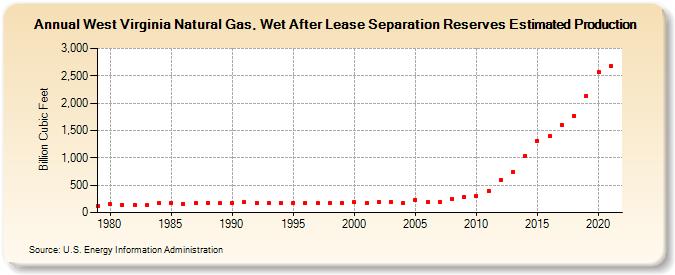
| West Virginia Natural Gas, Wet After Lease Separation Reserves Estimated Production (Billion Cubic Feet) | |||||
| Decade | Year-0 | Year-1 | Year-2 | Year-3 | Year-4 | Year-5 | Year-6 | Year-7 | Year-8 | Year-9 |
|---|---|---|---|---|---|---|---|---|---|---|
| 1970's | 124 | |||||||||
| 1980's | 160 | 145 | 142 | 134 | 174 | 173 | 161 | 176 | 182 | 170 |
| 1990's | 178 | 186 | 179 | 179 | 182 | 171 | 182 | 173 | 176 | 179 |
| 2000's | 184 | 167 | 202 | 194 | 175 | 235 | 193 | 198 | 256 | 284 |
| 2010's | 300 | 402 | 599 | 742 | 1,042 | 1,315 | 1,400 | 1,601 | 1,771 | 2,138 |
| 2020's | 2,564 | 2,670 |
| - = No Data Reported; -- = Not Applicable; NA = Not Available; W = Withheld to avoid disclosure of individual company data. |
| Release Date: 12/30/2022 |
| Next Release Date: NA |