|
Download Data (XLS File) |
|
|||||
|
|||||
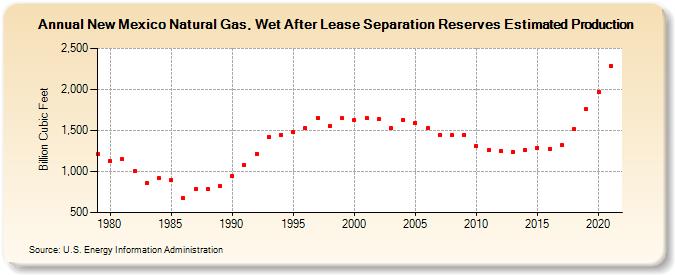
| New Mexico Natural Gas, Wet After Lease Separation Reserves Estimated Production (Billion Cubic Feet) | |||||
| Decade | Year-0 | Year-1 | Year-2 | Year-3 | Year-4 | Year-5 | Year-6 | Year-7 | Year-8 | Year-9 |
|---|---|---|---|---|---|---|---|---|---|---|
| 1970's | 1,213 | |||||||||
| 1980's | 1,127 | 1,150 | 1,002 | 856 | 917 | 896 | 677 | 790 | 793 | 819 |
| 1990's | 951 | 1,080 | 1,218 | 1,419 | 1,449 | 1,483 | 1,530 | 1,655 | 1,555 | 1,646 |
| 2000's | 1,623 | 1,649 | 1,634 | 1,526 | 1,632 | 1,594 | 1,525 | 1,445 | 1,442 | 1,445 |
| 2010's | 1,312 | 1,260 | 1,254 | 1,242 | 1,263 | 1,290 | 1,278 | 1,319 | 1,512 | 1,758 |
| 2020's | 1,973 | 2,283 |
| - = No Data Reported; -- = Not Applicable; NA = Not Available; W = Withheld to avoid disclosure of individual company data. |
| Release Date: 12/30/2022 |
| Next Release Date: NA |