|
Download Data (XLS File) |
|
|||||
|
|||||
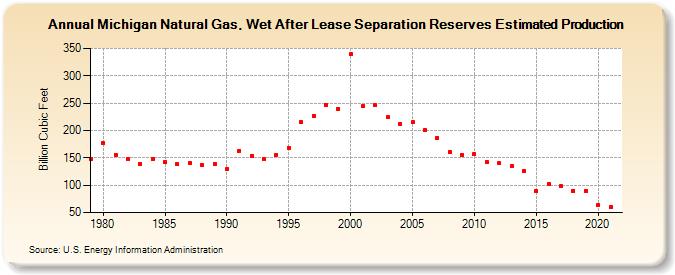
| Michigan Natural Gas, Wet After Lease Separation Reserves Estimated Production (Billion Cubic Feet) | |||||
| Decade | Year-0 | Year-1 | Year-2 | Year-3 | Year-4 | Year-5 | Year-6 | Year-7 | Year-8 | Year-9 |
|---|---|---|---|---|---|---|---|---|---|---|
| 1970's | 148 | |||||||||
| 1980's | 177 | 156 | 148 | 139 | 148 | 142 | 138 | 141 | 137 | 139 |
| 1990's | 129 | 163 | 154 | 147 | 156 | 168 | 215 | 227 | 246 | 240 |
| 2000's | 339 | 244 | 246 | 224 | 212 | 215 | 201 | 187 | 161 | 156 |
| 2010's | 157 | 142 | 140 | 135 | 126 | 89 | 102 | 98 | 90 | 90 |
| 2020's | 64 | 61 |
| - = No Data Reported; -- = Not Applicable; NA = Not Available; W = Withheld to avoid disclosure of individual company data. |
| Release Date: 12/30/2022 |
| Next Release Date: NA |