|
Download Data (XLS File) |
|
|||||
|
|||||
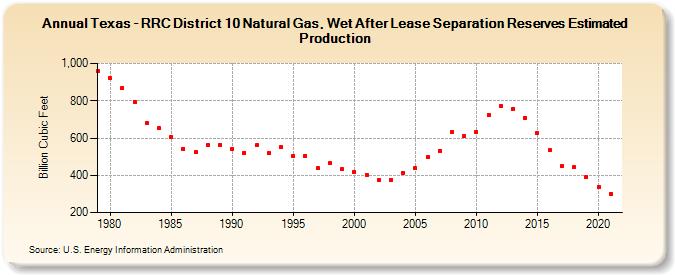
| Texas - RRC District 10 Natural Gas, Wet After Lease Separation Reserves Estimated Production (Billion Cubic Feet) | |||||
| Decade | Year-0 | Year-1 | Year-2 | Year-3 | Year-4 | Year-5 | Year-6 | Year-7 | Year-8 | Year-9 |
|---|---|---|---|---|---|---|---|---|---|---|
| 1970's | 962 | |||||||||
| 1980's | 920 | 871 | 795 | 681 | 652 | 607 | 542 | 524 | 564 | 564 |
| 1990's | 539 | 521 | 560 | 520 | 550 | 503 | 504 | 437 | 465 | 432 |
| 2000's | 420 | 402 | 377 | 376 | 414 | 439 | 497 | 532 | 630 | 610 |
| 2010's | 630 | 724 | 771 | 756 | 709 | 628 | 534 | 450 | 443 | 389 |
| 2020's | 335 | 302 |
| - = No Data Reported; -- = Not Applicable; NA = Not Available; W = Withheld to avoid disclosure of individual company data. |
| Release Date: 12/30/2022 |
| Next Release Date: NA |