|
Download Data (XLS File) |
|
|||||
|
|||||
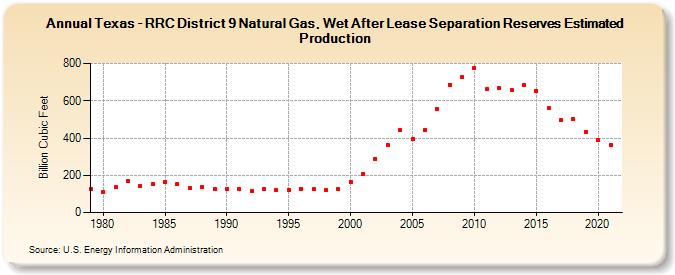
| Texas - RRC District 9 Natural Gas, Wet After Lease Separation Reserves Estimated Production (Billion Cubic Feet) | |||||
| Decade | Year-0 | Year-1 | Year-2 | Year-3 | Year-4 | Year-5 | Year-6 | Year-7 | Year-8 | Year-9 |
|---|---|---|---|---|---|---|---|---|---|---|
| 1970's | 124 | |||||||||
| 1980's | 113 | 135 | 172 | 143 | 153 | 166 | 151 | 133 | 139 | 125 |
| 1990's | 126 | 124 | 117 | 124 | 119 | 122 | 128 | 124 | 119 | 125 |
| 2000's | 164 | 206 | 289 | 365 | 445 | 395 | 443 | 554 | 686 | 725 |
| 2010's | 775 | 661 | 666 | 659 | 684 | 655 | 559 | 496 | 501 | 434 |
| 2020's | 391 | 362 |
| - = No Data Reported; -- = Not Applicable; NA = Not Available; W = Withheld to avoid disclosure of individual company data. |
| Release Date: 12/30/2022 |
| Next Release Date: NA |