|
Download Data (XLS File) |
|
|||||
|
|||||
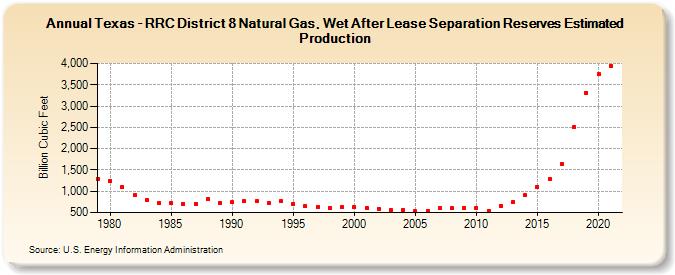
| Texas - RRC District 8 Natural Gas, Wet After Lease Separation Reserves Estimated Production (Billion Cubic Feet) | |||||
| Decade | Year-0 | Year-1 | Year-2 | Year-3 | Year-4 | Year-5 | Year-6 | Year-7 | Year-8 | Year-9 |
|---|---|---|---|---|---|---|---|---|---|---|
| 1970's | 1,292 | |||||||||
| 1980's | 1,240 | 1,092 | 912 | 795 | 727 | 728 | 703 | 711 | 812 | 729 |
| 1990's | 741 | 765 | 765 | 734 | 760 | 702 | 646 | 639 | 618 | 630 |
| 2000's | 623 | 609 | 592 | 550 | 559 | 527 | 542 | 599 | 601 | 608 |
| 2010's | 617 | 540 | 654 | 746 | 912 | 1,108 | 1,295 | 1,651 | 2,508 | 3,315 |
| 2020's | 3,753 | 3,949 |
| - = No Data Reported; -- = Not Applicable; NA = Not Available; W = Withheld to avoid disclosure of individual company data. |
| Release Date: 12/30/2022 |
| Next Release Date: NA |