|
Download Data (XLS File) |
|
|||||
|
|||||
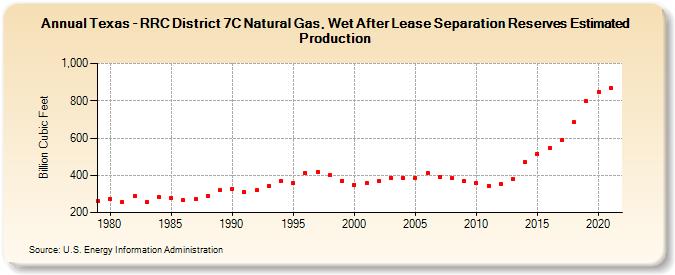
| Texas - RRC District 7C Natural Gas, Wet After Lease Separation Reserves Estimated Production (Billion Cubic Feet) | |||||
| Decade | Year-0 | Year-1 | Year-2 | Year-3 | Year-4 | Year-5 | Year-6 | Year-7 | Year-8 | Year-9 |
|---|---|---|---|---|---|---|---|---|---|---|
| 1970's | 264 | |||||||||
| 1980's | 275 | 257 | 287 | 254 | 281 | 277 | 266 | 271 | 289 | 319 |
| 1990's | 328 | 311 | 319 | 344 | 368 | 358 | 412 | 419 | 400 | 371 |
| 2000's | 350 | 356 | 368 | 387 | 387 | 388 | 412 | 390 | 383 | 370 |
| 2010's | 357 | 344 | 354 | 381 | 469 | 516 | 549 | 589 | 684 | 796 |
| 2020's | 845 | 869 |
| - = No Data Reported; -- = Not Applicable; NA = Not Available; W = Withheld to avoid disclosure of individual company data. |
| Release Date: 12/30/2022 |
| Next Release Date: NA |