|
Download Data (XLS File) |
|
|||||
|
|||||
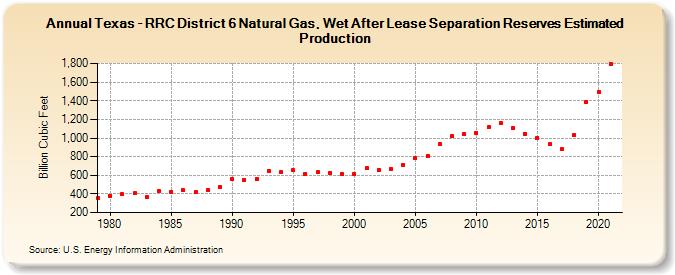
| Texas - RRC District 6 Natural Gas, Wet After Lease Separation Reserves Estimated Production (Billion Cubic Feet) | |||||
| Decade | Year-0 | Year-1 | Year-2 | Year-3 | Year-4 | Year-5 | Year-6 | Year-7 | Year-8 | Year-9 |
|---|---|---|---|---|---|---|---|---|---|---|
| 1970's | 351 | |||||||||
| 1980's | 381 | 395 | 407 | 367 | 429 | 422 | 439 | 418 | 440 | 476 |
| 1990's | 558 | 548 | 560 | 649 | 630 | 654 | 618 | 631 | 626 | 616 |
| 2000's | 612 | 676 | 655 | 668 | 713 | 783 | 808 | 933 | 1,018 | 1,041 |
| 2010's | 1,053 | 1,115 | 1,162 | 1,105 | 1,046 | 1,004 | 934 | 877 | 1,030 | 1,387 |
| 2020's | 1,489 | 1,792 |
| - = No Data Reported; -- = Not Applicable; NA = Not Available; W = Withheld to avoid disclosure of individual company data. |
| Release Date: 12/30/2022 |
| Next Release Date: NA |