|
Download Data (XLS File) |
|
|||||
|
|||||
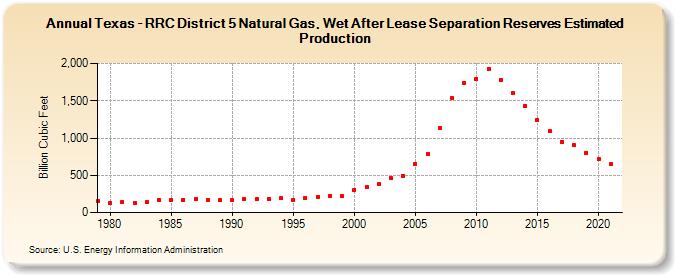
| Texas - RRC District 5 Natural Gas, Wet After Lease Separation Reserves Estimated Production (Billion Cubic Feet) | |||||
| Decade | Year-0 | Year-1 | Year-2 | Year-3 | Year-4 | Year-5 | Year-6 | Year-7 | Year-8 | Year-9 |
|---|---|---|---|---|---|---|---|---|---|---|
| 1970's | 157 | |||||||||
| 1980's | 129 | 145 | 134 | 138 | 172 | 173 | 173 | 180 | 170 | 163 |
| 1990's | 165 | 176 | 179 | 180 | 191 | 173 | 193 | 215 | 228 | 222 |
| 2000's | 308 | 339 | 382 | 461 | 495 | 654 | 786 | 1,134 | 1,535 | 1,739 |
| 2010's | 1,796 | 1,928 | 1,783 | 1,603 | 1,434 | 1,237 | 1,088 | 950 | 903 | 804 |
| 2020's | 718 | 646 |
| - = No Data Reported; -- = Not Applicable; NA = Not Available; W = Withheld to avoid disclosure of individual company data. |
| Release Date: 12/30/2022 |
| Next Release Date: NA |