|
Download Data (XLS File) |
|
|||||
|
|||||
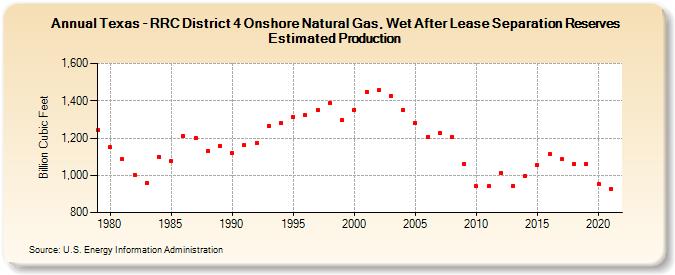
| Texas - RRC District 4 Onshore Natural Gas, Wet After Lease Separation Reserves Estimated Production (Billion Cubic Feet) | |||||
| Decade | Year-0 | Year-1 | Year-2 | Year-3 | Year-4 | Year-5 | Year-6 | Year-7 | Year-8 | Year-9 |
|---|---|---|---|---|---|---|---|---|---|---|
| 1970's | 1,243 | |||||||||
| 1980's | 1,150 | 1,087 | 1,002 | 960 | 1,100 | 1,077 | 1,210 | 1,201 | 1,130 | 1,159 |
| 1990's | 1,118 | 1,160 | 1,175 | 1,267 | 1,278 | 1,315 | 1,321 | 1,353 | 1,386 | 1,297 |
| 2000's | 1,352 | 1,449 | 1,456 | 1,427 | 1,350 | 1,280 | 1,208 | 1,226 | 1,206 | 1,062 |
| 2010's | 941 | 941 | 1,013 | 943 | 995 | 1,054 | 1,113 | 1,086 | 1,063 | 1,062 |
| 2020's | 952 | 927 |
| - = No Data Reported; -- = Not Applicable; NA = Not Available; W = Withheld to avoid disclosure of individual company data. |
| Release Date: 12/30/2022 |
| Next Release Date: NA |